Forest plots are most commonly used in reporting meta-analyses, but can be profitably used to summarise the results of a fitted model. They essentially display the estimates for model parameters and their corresponding confidence intervals.
Matt Shotwell just posted a message to the R-help mailing list with his lattice-based solution to the problem of creating forest plots in R. I just figured out how to create a forest plot for a consulting report using ggplot2. The availability of the geom_pointrange layer makes this process very easy!!
Update January 26, 2016: ggplot2 has changed a bit in the last five years. I’ve created a gist that will be easier to maintain. The link is here.
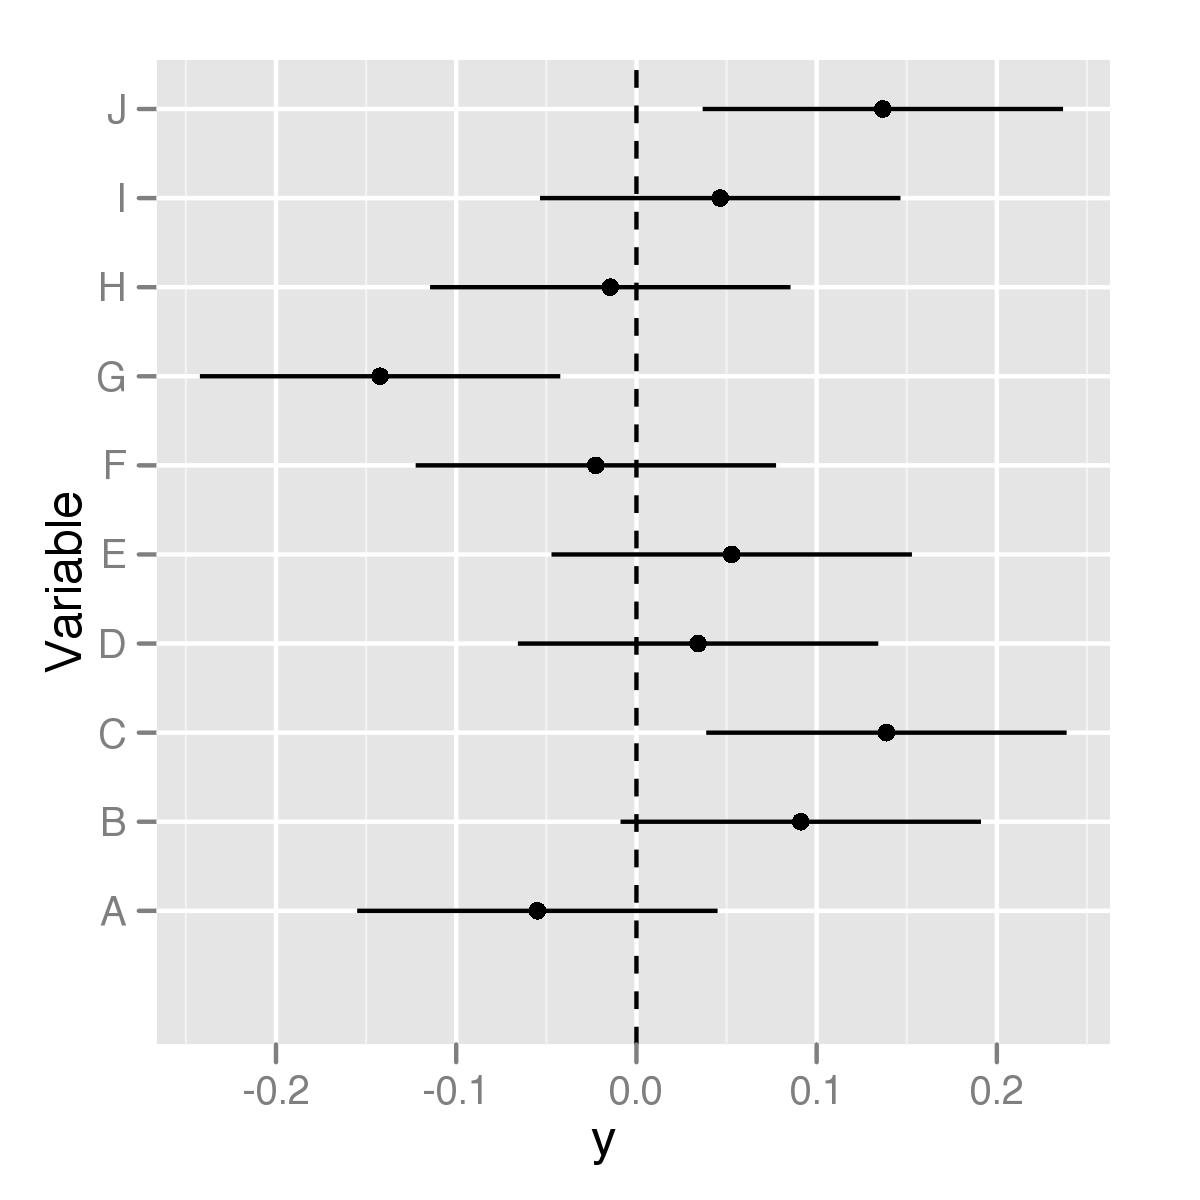
[code language="r"] credplot.gg <- function(d){ # d is a data frame with 4 columns # d$x gives variable names # d$y gives center point # d$ylo gives lower limits # d$yhi gives upper limits require(ggplot2) p <- ggplot(d, aes(x=x, y=y, ymin=ylo, ymax=yhi))+ geom_pointrange()+ geom_hline(yintercept = 0, linetype=2)+ coord_flip()+ xlab('Variable') return(p) } [/code]
If we start with some dummy data, like
d <- data.frame(x = toupper(letters[1:10]),
                y = rnorm(10, 0, 0.1))
d <- transform(d, ylo = y-1/10, yhi=y+1/10)

credplot.gg(d)
we can get the following graph: